This training plan is designed to equip Sales Managers with the skills, knowledge, and tools necessary to excel in their role, lead their team effectively, and drive sales growth. The program is structured into phases covering foundational, advanced, and ongoing development.
Table of Contents
Overview
- Duration: 4 Weeks (Initial Training) + Ongoing Development
- Format: Blended (In-person workshops, virtual sessions, self-paced modules)
- Focus Areas:
- Leadership and Team Management
- Sales Strategies and Techniques
- Client Relationship Management
- CRM and Data-Driven Decision Making
- Product Knowledge and Brand Alignment
Training Plan Phases
Phase 1: Orientation and Foundations (Week 1)
- Goal: Familiarize the Sales Manager with BODY TIME’s culture, values, products, and operations.
Activities:
- Introduction to BODY TIME:
- Company mission, vision, and values.
- Overview of services (EMS training, Eximia, iBody, etc.).
- Team Structure and Roles:
- Understanding team responsibilities (sales team, call agents, trainers).
- Product Training:
- Deep dive into BODY TIME’s unique selling points (e.g., EMS benefits, Eximia results).
- Hands-on demonstrations of key products and services.
- Tools and Systems Overview:
- Introduction to the CRM platform.
- Overview of reporting and data-tracking tools.
Phase 2: Leadership and Team Management (Week 2)
- Goal: Develop skills to lead and inspire a high-performing sales team.
Activities:
- Effective Leadership Skills:
- Coaching techniques to motivate and develop team members.
- Conflict resolution and problem-solving strategies.
- Performance Management:
- Setting clear, achievable goals for the team.
- Conducting regular performance reviews and feedback sessions.
- Team Dynamics:
- Building a collaborative team culture.
- Strategies to retain top talent.
Phase 3: Sales Strategies and Client Engagement (Week 3)
- Goal: Master sales techniques and improve client relationship management.
Activities:
- Sales Fundamentals:
- Lead generation and qualification.
- Mastering the sales funnel (Inquiry → Consultation → Conversion).
- Advanced Sales Techniques:
- Consultative selling tailored to BODY TIME’s client base.
- Objection handling and closing strategies.
- Client Retention Strategies:
- Upselling and cross-selling (e.g., combining EMS with Eximia).
- Building long-term relationships with clients.
- Customer-Centric Approach:
- How to deliver exceptional client experiences.
Phase 4: CRM and Data-Driven Decision Making (Week 4)
- Goal: Utilize technology and analytics to optimize sales performance.
Activities:
- CRM Mastery:
- Logging client interactions and tracking leads.
- Using CRM to monitor team performance.
- Data Analysis:
- Analyzing key metrics (e.g., conversion rates, revenue).
- Forecasting sales and setting realistic targets.
- Automation and Efficiency:
- Streamlining processes using CRM tools (e.g., automated follow-ups).
Phase 5: Ongoing Development (Post Training)
- Goal: Foster continuous learning and improvement.
Activities:
- Monthly Coaching Sessions:
- One-on-one sessions with senior leaders for feedback and guidance.
- Workshops and Seminars:
- Advanced topics like negotiation tactics or team scaling strategies.
- Peer Learning:
- Regular meetings with other Sales Managers to share challenges and solutions.
- Performance Check-ins:
- Quarterly reviews to assess progress and address areas for improvement.
Training Tools and Resources
- Materials:
- BODY TIME sales scripts and objection-handling guides.
- Product manuals and case studies.
- Technology:
- CRM software tutorials.
- Access to e-learning platforms for sales and leadership courses.
- Role-Playing and Simulations:
- Mock client interactions to practice sales and conflict resolution.
Success Metrics
To evaluate the effectiveness of the training program:
- Knowledge Retention:
- Post-training assessments (e.g., quizzes on BODY TIME products and CRM usage).
- Team Performance Improvement:
- Increase in team sales performance within the first 3 months.
- Manager’s KPI Achievement:
- Meeting or exceeding KPIs such as revenue targets, team engagement, and client retention.
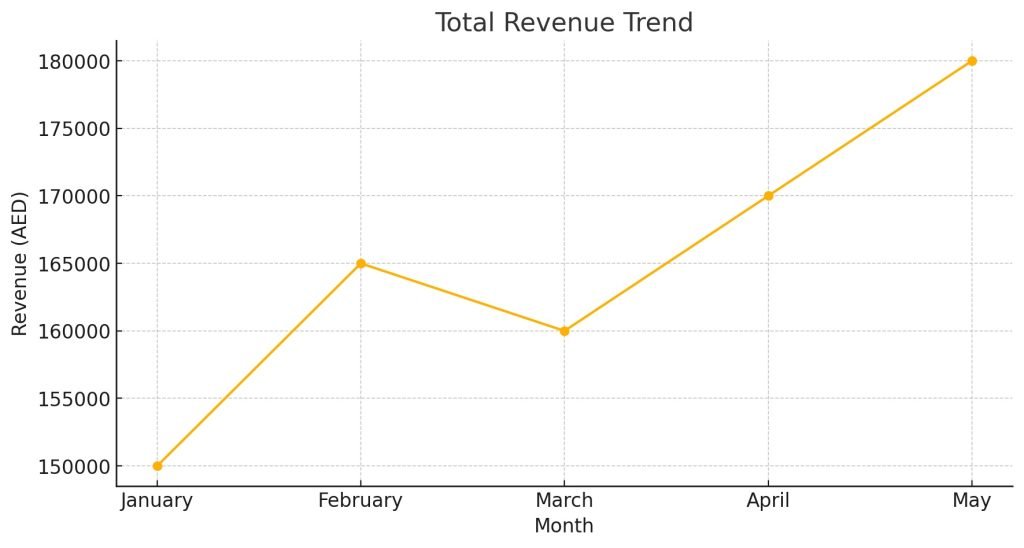
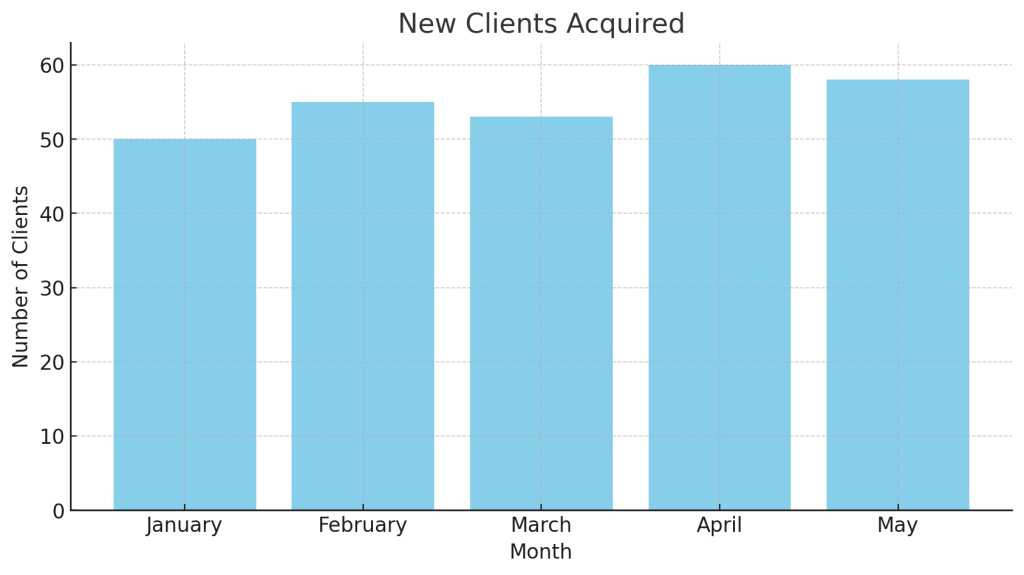
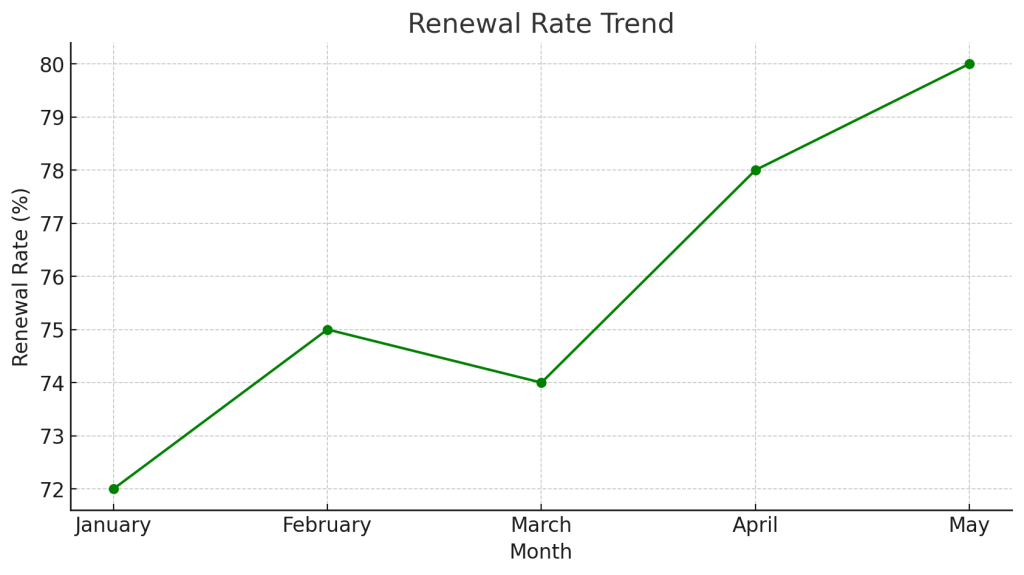
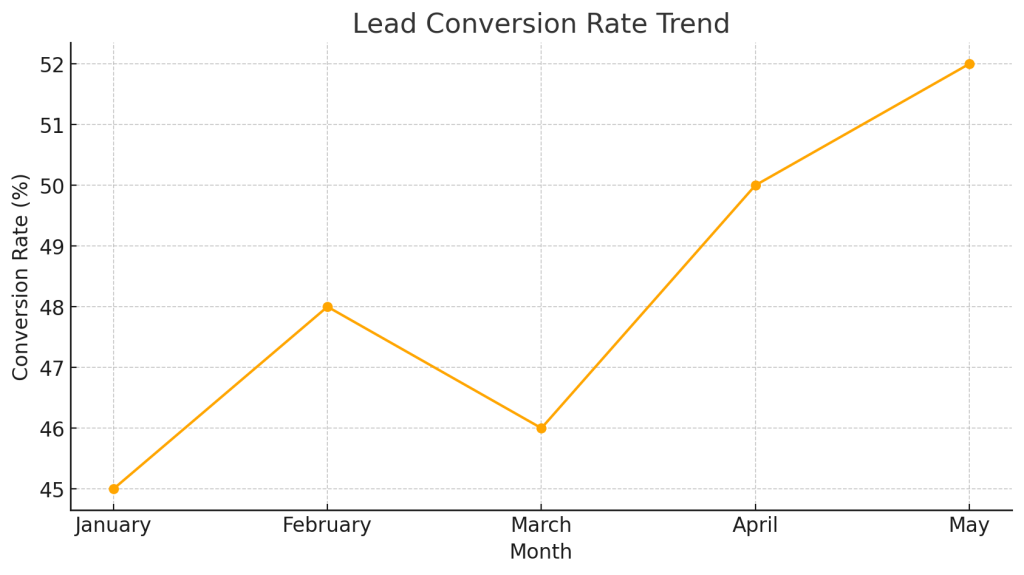
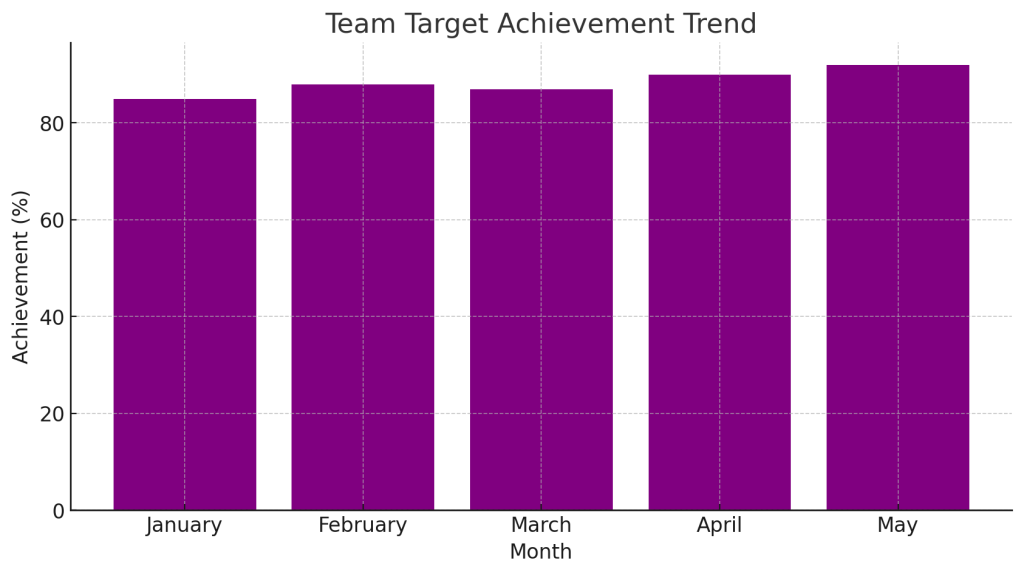
Sales Manager KPI Dashboard
| Month | Total Revenue (AED) | New Clients Acquired | Renewal Rate (%) | Lead Conversion Rate (%) | Team Target Achievement (%) |
| January | 150000 | 50 | 72 | 45 | 85 |
| February | 165000 | 55 | 75 | 48 | 88 |
| March | 160000 | 53 | 74 | 46 | 87 |
| April | 170000 | 60 | 78 | 50 | 90 |
| May | 180000 | 58 | 80 | 52 | 92 |
How to track sales progress
Tracking sales progress is crucial for understanding performance, identifying areas for improvement, and achieving revenue goals. Here’s a comprehensive guide to effectively track sales progress:
1. Define Key Metrics to Track
Establish the core metrics that reflect your sales performance. Examples include:
- Total Revenue: The total sales amount generated in a specific period.
- Lead Conversion Rate: The percentage of leads converted into paying clients. Conversion Rate = (Number of Sales / Number of Leads)×100
- Sales Target Achievement: How close you are to meeting set sales goals. Target Achievement = (Actual Sales / Sales Target)×100
- Average Deal Size: The average revenue generated per client or transaction.
- Sales Cycle Length: The time taken to convert a lead into a sale.
2. Utilize a Sales Funnel
A sales funnel visualizes the buyer’s journey and helps identify where prospects drop off. Common stages include:
- Lead Generation: New inquiries or prospects.
- Lead Qualification: Assessing interest and fit.
- Consultation or Trial: Providing a demonstration or session.
- Conversion: Closing the sale.
- Retention: Ensuring repeat business or renewals.
Track the number of prospects in each stage and their progression.
3. Use a CRM System
A CRM (Customer Relationship Management) tool is essential for tracking sales progress in real-time. Key features to leverage include:
- Pipeline Tracking: Monitor leads through each sales stage.
- Automation: Automate follow-ups, reminders, and notifications.
- Analytics and Reporting: Generate insights on conversion rates, revenue, and sales activities.
Popular CRM tools for sales tracking:
- HubSpot CRM: Free version available with robust tracking features.
- Zoho CRM: Affordable and customizable.
- Salesforce: Advanced analytics for large teams.
4. Monitor Performance Against Targets
- Weekly/Monthly Reports: Compare actual sales to targets for each time period.
- Team Performance Tracking: Evaluate individual team members’ contributions to total sales.
- Trend Analysis: Identify patterns in sales activity over time to spot seasonality or areas of decline.
5. Leverage Dashboards
Create visual dashboards to track KPIs and provide a snapshot of sales performance. Include:
- Revenue trends (daily, weekly, monthly).
- Sales by product or service.
- Top-performing team members.
- Pipeline health (leads in each funnel stage).
6. Track Activities and Efforts
Monitor sales activities that drive progress, such as:
- Number of Calls/Emails: Volume of outreach efforts.
- Meetings Held: Number of client consultations or demos conducted.
- Follow-Ups: Timeliness and effectiveness of follow-up actions.
7. Identify and Address Bottlenecks
- Analyze where leads drop off in the funnel and determine why (e.g., poor follow-up, unclear pricing).
- Focus on improving specific stages to increase conversions.
8. Incorporate Feedback Loops
- From Clients: Gather feedback to understand why deals were won or lost.
- From Sales Team: Identify challenges and refine strategies.
9. Review and Adjust Regularly
- Conduct weekly or monthly reviews to analyze progress.
- Adjust sales strategies, targets, or team focus based on insights.
10. Use Scorecards for Individual Team Members
Track individual performance to ensure accountability:
- Revenue generated.
- Conversion rates.
- Client satisfaction scores.
Example Sales Progress Workflow
- Set Monthly Target: e.g., 150,000 AED.
- Track Leads in CRM:
- 200 leads → 100 consultations → 60 conversions.
- Analyze Conversion Rate:\text{Conversion Rate} = \left( \frac{60}{200} \right) \times 100 = 30% ]
- Review Team Performance:
- Salesperson A: 30 conversions.
- Salesperson B: 20 conversions.
- Salesperson C: 10 conversions.
- Generate Dashboard:
- Show revenue trends, team contributions, and funnel progression.
Sales Progress Tracking Template
| Date | Total Leads | Consultations Held | Conversions | Revenue Generated (AED) | Follow-Ups Completed | Conversion Rate (%) |
| 2024-12-01 | 50 | 30 | 15 | 30000 | 40 | 30 |
| 2024-12-02 | 60 | 35 | 18 | 36000 | 45 | 30 |
| 2024-12-03 | 55 | 33 | 17 | 34000 | 42 | 31 |
| 2024-12-04 | 65 | 40 | 22 | 44000 | 50 | 34 |
| 2024-12-05 | 70 | 45 | 25 | 50000 | 55 | 36 |
Sales tracking dashboard details
A sales tracking dashboard is a visual representation of your sales data, designed to provide insights into performance metrics and key trends. It helps sales managers and teams monitor progress, identify bottlenecks, and make data-driven decisions. Here’s a breakdown of what a comprehensive sales tracking dashboard should include:
Key Components of a Sales Tracking Dashboard
1. Overview Section
- Purpose: Provide a quick summary of sales performance.
- Details:
- Total Revenue: Total sales generated within a selected period (daily, weekly, monthly).
- Sales Target Achievement: Percentage of sales target reached.
- Top Performer: Salesperson with the highest contribution to revenue.
2. Sales Pipeline Status
- Purpose: Show the progression of leads through the sales funnel.
- Details:
- Number of leads at each stage (e.g., inquiry, consultation, follow-up, conversion).
- Conversion rates for each stage.
- Average time spent in each stage of the pipeline.
Visualization:
- Funnel chart or bar chart.
3. Revenue Trends
- Purpose: Highlight revenue performance over time.
- Details:
- Daily, weekly, or monthly revenue trends.
- Comparison with previous periods.
- Revenue contribution by product or service (e.g., EMS sessions, Eximia treatments).
Visualization:
- Line chart for trends.
- Pie chart or stacked bar chart for revenue breakdown.
4. Team Performance
- Purpose: Track individual contributions to team goals.
- Details:
- Number of leads handled per salesperson.
- Number of consultations completed.
- Revenue generated by each team member.
- Conversion rates by team member.
Visualization:
- Bar chart or leaderboard-style table.
5. Client Retention and Renewals
- Purpose: Measure client loyalty and repeat business.
- Details:
- Renewal rate (% of clients who renewed memberships).
- Churn rate (% of clients who did not renew).
- Average client lifetime value (CLV).
Visualization:
- Percentage dials for renewal and churn rates.
- Line chart for CLV over time.
6. Lead Generation Metrics
- Purpose: Monitor the effectiveness of marketing efforts.
- Details:
- Number of leads generated from each source (e.g., online ads, referrals, walk-ins).
- Cost per lead (CPL).
- Lead-to-conversion rate by source.
Visualization:
- Pie chart for lead sources.
- Bar chart for lead-to-conversion rates.
7. Activity Metrics
- Purpose: Track daily activities that drive sales.
- Details:
- Number of follow-ups completed.
- Calls or emails sent.
- Number of consultations booked.
Visualization:
- Line chart or heatmap to display activity trends.
8. Forecasting and Projections
- Purpose: Predict future sales performance based on current trends.
- Details:
- Projected revenue for the next period.
- Expected conversion rates.
- Pipeline value (potential revenue from active leads).
Visualization:
- Forecast line overlayed on revenue trend charts.
Key Features of a Sales Dashboard
Real-Time Updates
- Integrate with CRM tools for live data updates.
- Reflect real-time progress for immediate decision-making.
Filters
- Allow filtering by time period, salesperson, product/service, or location.
Customizable Widgets
- Add or modify widgets to focus on specific KPIs based on changing priorities.
Interactive Visualizations
- Enable drill-down capabilities for more detailed insights (e.g., clicking on a revenue bar to see individual transactions).
Benefits of a Sales Tracking Dashboard
- Enhanced Visibility: Clear insights into overall sales performance and team contributions.
- Data-Driven Decisions: Helps prioritize efforts where they’re most needed (e.g., focusing on stages with low conversion rates).
- Improved Accountability: Makes it easier to track individual and team performance.
- Timely Action: Real-time data enables quick adjustments to strategies.
Best Tools for Sales Dashboards
- CRM Tools:
- HubSpot CRM: Offers a customizable dashboard for tracking sales and pipeline metrics.
- Salesforce: Advanced analytics for larger teams.
- Zoho CRM: Affordable and user-friendly dashboards.
- BI Tools:
- Tableau: For advanced data visualizations and analysis.
- Power BI: Integrates with multiple data sources for robust dashboards.
- Fitness-Specific Platforms:
- Mindbody: For gyms and fitness centers, with integrated sales tracking.
- WellnessLiving: Tracks memberships, renewals, and revenues.
Steps to Set Up a Sales Dashboard
- Identify Key Metrics: Focus on the most impactful KPIs for BODY TIME’s business model.
- Choose a Platform: Select a CRM or BI tool that aligns with your needs.
- Connect Data Sources: Integrate the tool with lead management systems, payment processors, and marketing platforms.
- Design Visualizations: Create charts, graphs, and tables that simplify complex data.
- Automate Reports: Schedule daily, weekly, or monthly updates for team reviews.